
Client Highlights
We measure our success by the success of our clients. These partnerships represent real problems solved: dashboards that actually get used, systems that scale with the organization, and tools teams can maintain on their own.
Every project starts with listening. We learn how your team works, what's getting in the way, and what success looks like for you. Then we build something that fits.


Evolving a Static Report into A Interactive & AI-Powered Dashboard for International Economic Development Council (IEDC)’s 2025 State of the Field Survey Report
Daly Analytics developed an advanced R Shiny dashboard that transformed IEDC's static survey data into a dynamic, revenue-generating benchmarking tool for 5,000+ members.
Multi-page interactive application with executive summaries, survey visualizations, and seven-dimensional filtering
AI-powered natural language query interface enabling intuitive data exploration
Privacy-first design protecting respondent identity throughout the platform
Custom managed hosting architecture with automatic failover, integrated with IECD's member paywall and IT systems
Enterprise-grade performance delivering zero downtime at launch and sub-second load times.
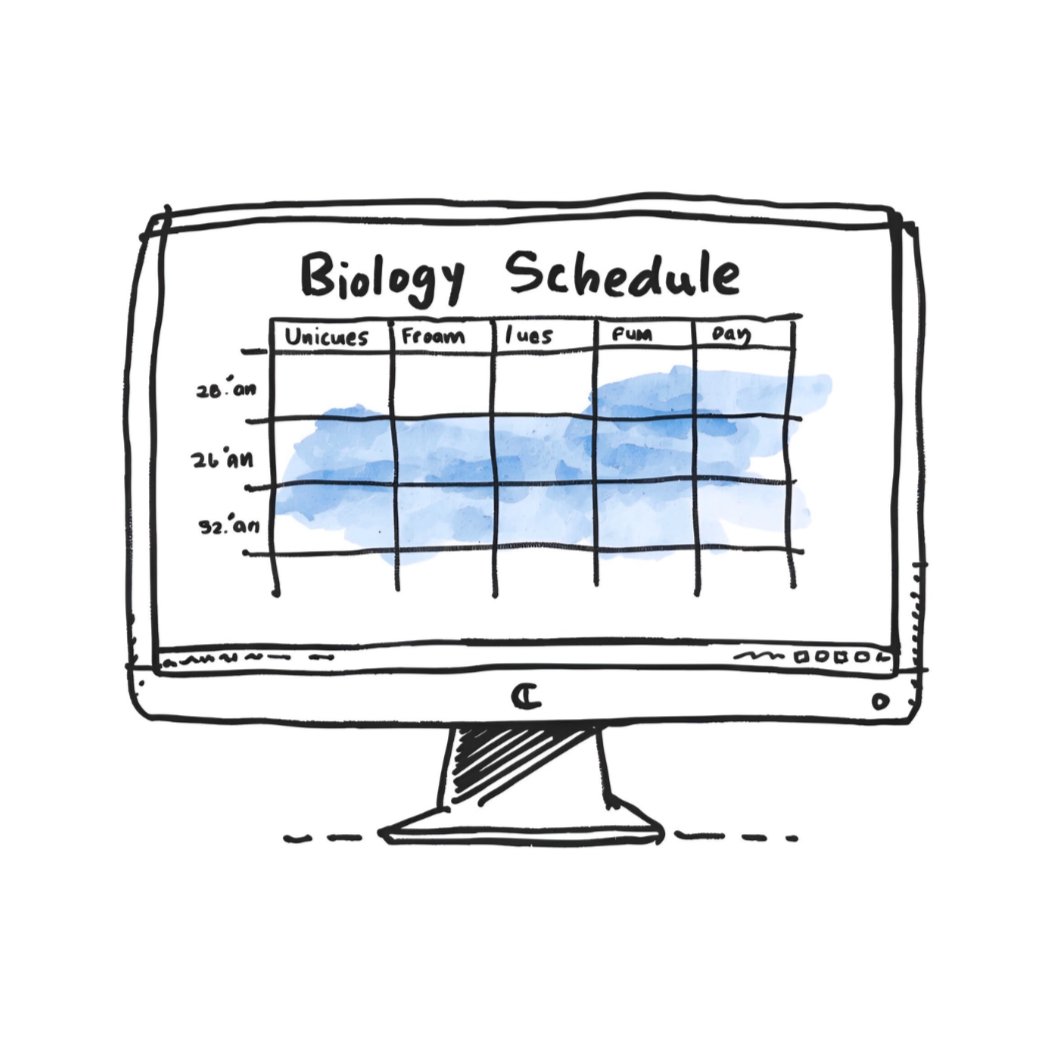
Transforming Mercer University’s Biology Departments Complex Spreadsheet Workflow with a Custom Intelligent Course Scheduling App
Daly Analytics partnered with Mercer University's Biology Department to replace fragile spreadsheets with Tidy Scheduler—a custom R Shiny application that streamlined course scheduling with real-time conflict detection.
Interactive visual calendar displaying courses with real-time conflict detection for professor schedules and room bookings
Editable data tables with bulk operations for efficient schedule management
Multi-format CSV import enabling flexible data integration
Mobile-responsive design providing accessibility across devices
Scalable, user-friendly system replacing manual spreadsheet workflows with automated scheduling.

Leveling Up Panthera’s Data Management Software Platform for International Wild Cat Conservation Programming
Daly Analytics is embedded with Panthera's Conservation Technology South Africa Team in a 12+ month engagement to modernize their development workflows and optimize their analytics infrastructure.
Hands-on Shiny app development alongside engineering and support staff
Performance testing and evaluation to identify optimization opportunities
Docker configuration optimization for complicated deployment architectures
Technical advising and architecture recommendations to modernize development practices
Extended engagement model providing sustained expertise and knowledge transfer
Developing New Technical Documentation to Improve Open Source Software Development for the Entire R Programming Community
Daly Analytics led an R Consortium-funded project team to author and publish the CRAN Cookbook—a comprehensive guidebook helping R package maintainers navigate common CRAN submission issues.
Easy-to-follow recipes for implementing and discovering solutions to common CRAN submission challenges
Project team coordination with writers and industry/academic advisors
Technical writing and project management improving skillsets of package maintainers and budding developers
User-friendly Quarto website delivering accessible, well-organized content
Community impact supporting the broader R package development ecosystem

Radically Improving the Professional Look and Feel of an Optimization App for Data Driven Supply Chain
Daly Analytics delivered timely UI/UX improvements for Data Driven Supply Chain's proprietary R Shiny application ahead of a critical industry demo, reorganizing architecture and implementing custom styling.
Project architecture reorganization improving code structure and maintainability
Custom CSS styling aligned with client's brand identity
Enhanced user experience guiding end users through plant and data center optimization simulations
Rapid turnaround delivery with timely updates to meet demo deadline
Direct code integration jumping into existing codebase for immediate impact

Kind Words From Kind Folks